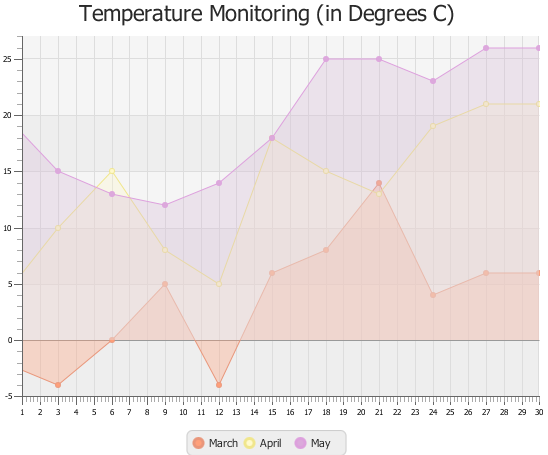
Description of "Figure 1-3 Area Chart Styled with CSS"
The CSS file with the corresponding styles are shown in Example 1-2.
| Example 1-2 Area Chart Styles
.default-color0.chart-area-symbol { -fx-background-color: #e9967a, #ffa07a; }
.default-color1.chart-area-symbol { -fx-background-color: #f0e68c, #fffacd; }
.default-color2.chart-area-symbol { -fx-background-color: #dda0dd, #d8bfd855; }
.default-color0.chart-series-area-line { -fx-stroke: #e9967a; }
.default-color1.chart-series-area-line { -fx-stroke: #f0e68c; }
.default-color2.chart-series-area-line { -fx-stroke: #dda0dd; }
.default-color0.chart-series-area-fill { -fx-fill: #ffa07a55; }
.default-color1.chart-series-area-fill { -fx-fill: #fffacd55; }
.default-color2.chart-series-area-fill { -fx-fill: #d8bfd855; }
|
Find the complete list of the JavaFX CSS properties in JavaFX CSS Reference Guide.
Custom Chart
You can invent your own type of chart by extending the Chart class or the XYChart class. Figure 1-4 shows a custom implementation of the candlestick chart.
Figure 1-4 Sample of a Custom Chart
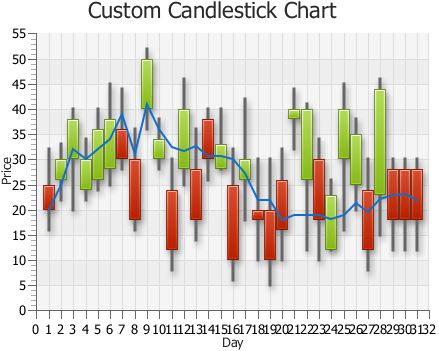
Description of "Figure 1-4 Sample of a Custom Chart"
To create a custom chart, you must override the methods of the Chart or XYChart classes that are necessary to enable specific chart capabilities. You also must create a new Node object to represent a single data item.
See the Charts section of the Ensemble application available on the product site to evaluate the implementation details.
Pie Chart
This chapter describes a chart that represents data in a form of circle divided into triangular wedges called slices. Each slice represents a percentage that corresponds to a particular value.
Figure 2-1 shows a pie chart created by using the PieChart class. The colors of the slices are defined by the order of the corresponding data items added to the PieChart.Data array.
Figure 2-1 Typical Pie Chart
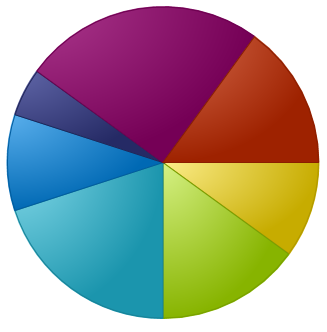
Description of "Figure 2-1 Typical Pie Chart"
Creating a Pie Chart
To create a pie chart in your JavaFX application, at a minimum, you must instantiate the PieChart class, define the data, assign the data items to the PieChart object, and add the chart to the application. When creating the chart data, define as many PieChart.Data objects for as many slices you want to appear. Each PieChart.Data object has two fields: the name of the pie slice and its corresponding value. Example 2-1 creates the basic pie chart.
| Example 2-1 Creating a Pie Chart
import javafx.application.Application;
import javafx.collections.FXCollections;
import javafx.collections.ObservableList;
import javafx.scene.Scene;
import javafx.stage.Stage;
import javafx.scene.chart.*;
import javafx.scene.Group;
public class PieChartSample extends Application {
@Override public void start(Stage stage) {
Scene scene = new Scene(new Group());
stage.setTitle("Imported Fruits");
stage.setWidth(500);
stage.setHeight(500);
ObservableList<PieChart.Data> pieChartData =
FXCollections.observableArrayList(
new PieChart.Data("Grapefruit", 13),
new PieChart.Data("Oranges", 25),
new PieChart.Data("Plums", 10),
new PieChart.Data("Pears", 22),
new PieChart.Data("Apples", 30));
final PieChart chart = new PieChart(pieChartData);
chart.setTitle("Imported Fruits");
((Group) scene.getRoot()).getChildren().add(chart);
stage.setScene(scene);
stage.show();
}
public static void main(String[] args) {
launch(args);
}
}
|
The result of compiling and running this application is shown in Figure 2-2.